
Davis Group
A few recent papers (published, in press, submitted, or nearing submission) and active research projects led by group members are briefly summarized below.
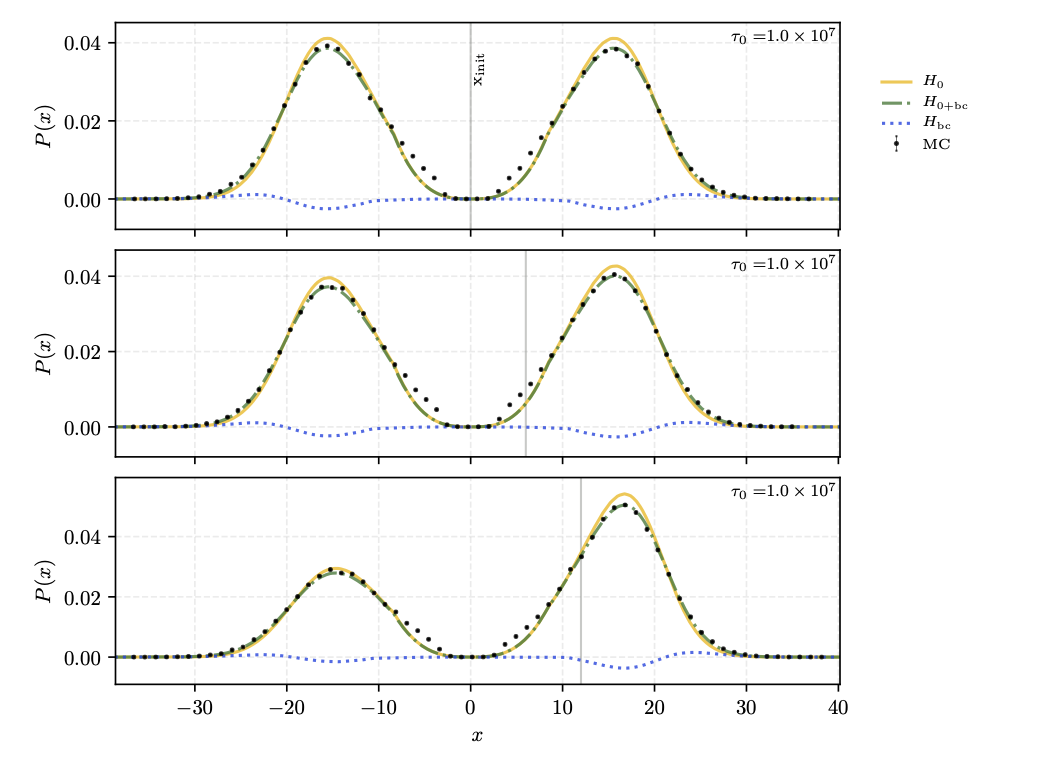
Connor McClellan is leading a project to construct semi-analytic solutions for the escape of Lyman α photons from a uniform, optically thick sphere. Comparison with Monte Carlo calculations shows excellent agreement for sufficiently large line center optical depths. We plan to use these semi-analytic solution as the basis for an acceleration scheme in future Monte Carlo calculations. The plot on the left shows a comparison of binned Monte Carlo datapoints with a semi-analytic solution (green curve) for a line center optical depth of 107. The x-axis shows photon frequency in Doppler widths. The photons are launched with different initial frequencies (grey vertical line) in the different panels. Our new solution includes a proper treatment of the boundary condition that provides better agreement with the Monte Carlo results.
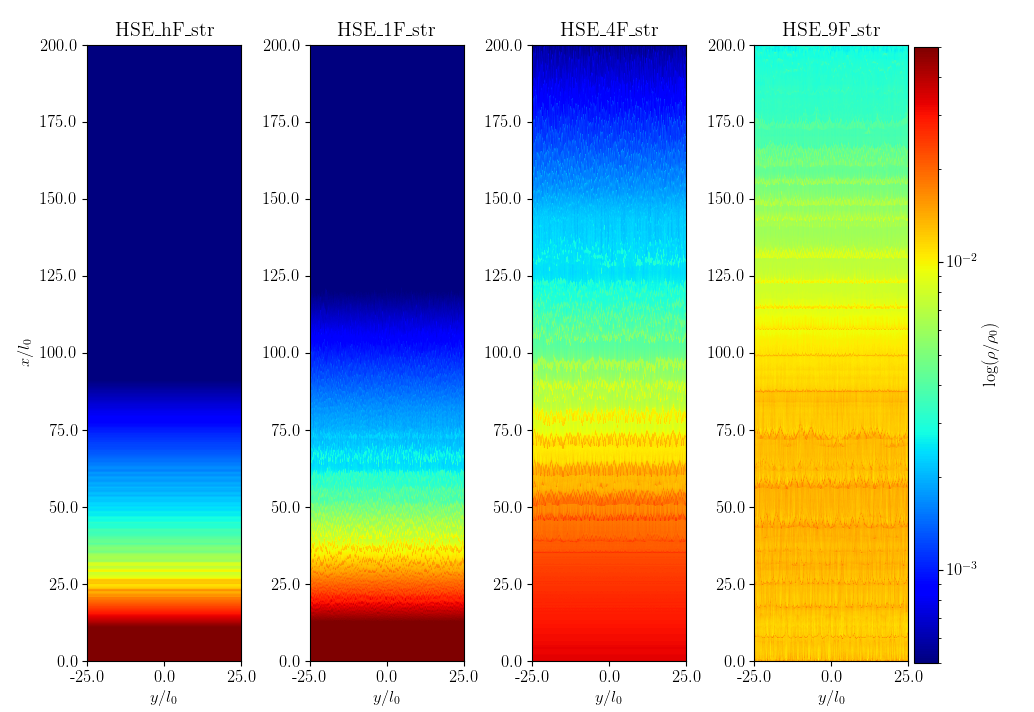
Xiaoshan Huang led a project to study the effects of an applied flux of cosmic rays on an initially hydrostatic atmosphere. Her numerical simulation results show that if the cosmic ray flux exceeds a characteristic value large outflows of mass will be accelerated by the cosmic ray pressure gradients that form, restructuring the atmosphere. The plot on the left shows the 2D density distribution of the gas in a series of runs with cosmic ray flux increasing from left to right. The higher flux runs have more extended density distributions due to the outflow. One can see inhomogenities forming due to the cosmic ray acoustic instability.
ADS Link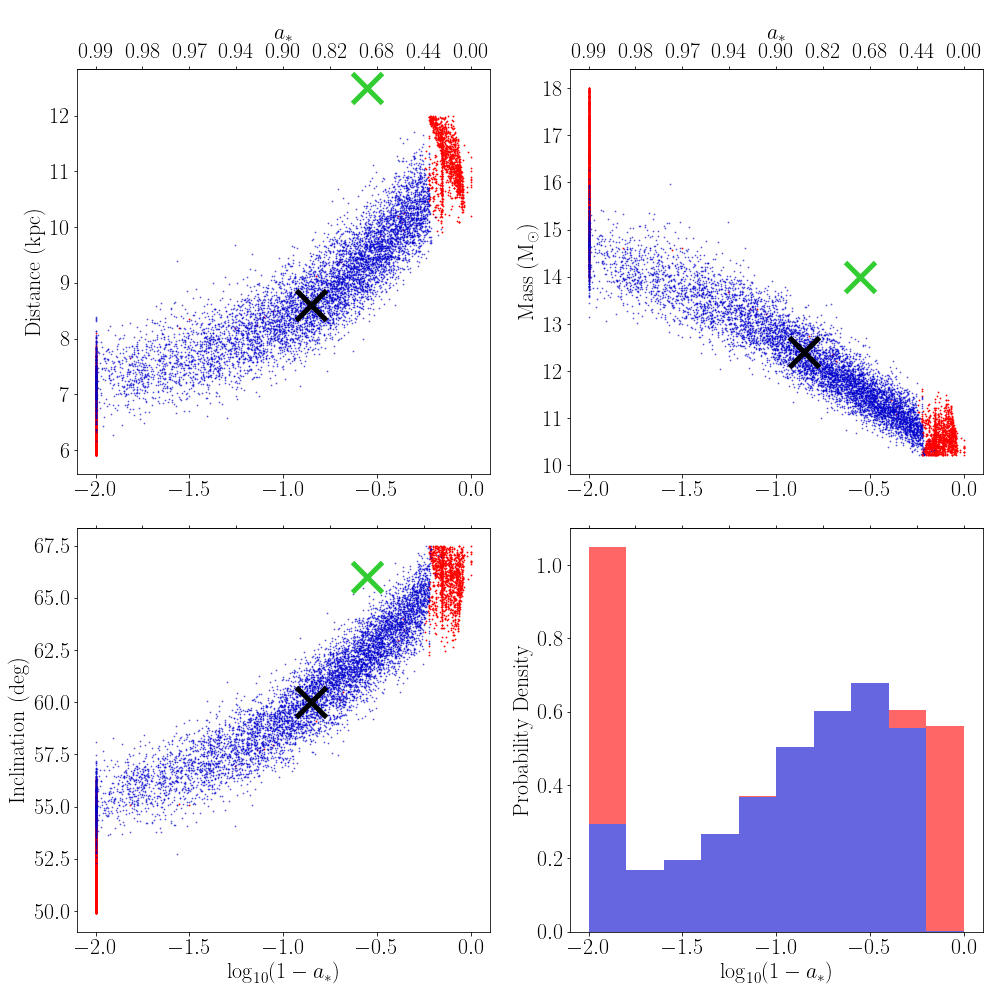
Bri Mills led a project to fit RXTE observations of GRS 1915+105 with accretion disk models to estimate the black hole spin while accounting for uncertainties in the distance to the source. The plot on the left shows a number of samples of the distance to the source, observer inclination, and black hole mass. The points are distributed according to uncertainties on the measured distance. The blue points represent system parameters for which good fits are possible while the red points represent poor fits. The black cross shows the results for the most likely system parameters. The panel in the lower right shows a histogram of the best fit spin, providing a sense of the uncertainty in the best-fit spin due to the uncertainty in the system parameters.
ADS Link